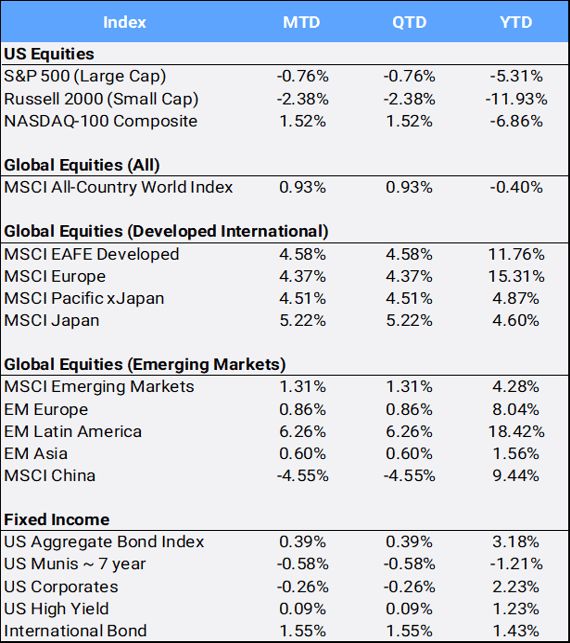
Although Global stocks gained 0.93% in April, it was a wild month! In the wake of “Liberation Day”, which President Donald Trump announced his administration’s plans for “reciprocal tariffs”, the MSCI All Country World Index (ACWI) dropped 9.96% at its monthly low before clawing back to finish in the black by month’s end. At one point, the global benchmark was off 16.07% from the all-time high it reached on February 18th. Markets were whipsawed by tariff-related trade concerns, with a steep selloff following the announcement on April 8th, then a series of rallies following easing geopolitical tensions amid mixed corporate earnings results. In the US, while the Nasdaq was able to eke out a 1.52% gain in April, the S&P and Dow fell 0.76% and 3.17%, respectively, marking their third consecutive month of declines. As of April 8th, those indexes were off 22.93%, 18.90%, and 16.37% from their all-time highs. A decline of more than 10% is considered a “correction” and more than 20% down as a “bear market”. The CBOE Volatility Index (VIX), often described to as the market’s “fear gauge” hit its crescendo of 57.52 intraday on April 8th, and finished the month at 24.70, up 10.86% and 42.36% YTD.
Click the image to view the chart larger.
Source: Bloomberg Pricing Data, as of April 30, 2025
In addition to the “tariff tantrum”, there was further market reaction as Trump stated a desire to fire the US Federal Reserve Chairman Jerome Powell, before rowing back those comments. Apart from the commotion over Powell’s position, the Fed Chairman noted the quandary facing the Fed regarding possible stagflation and its dual mandate of balancing employment and inflation. US Gross Domestic Product contracted by 0.3% in the first quarter, its first decline in three years. However, surging imports by consumers and businesses stocking up on inventory ahead of tariffs on most imported goods was the main drag on US growth. Inflation levels remained elevated, with the core Personal Consumption Expenditures (PCE) index expanding by 3.5%. Still, the White House continues to disapprove of the Federal Reserve for not lowering interest rates fast enough.
The US yield curve steepened this month as the 2- and 10-year key rates closed April at 3.60% and 4.16%, respectively, after beginning the month at 3.88% and 4.21% and the year at 4.24% and 4.57%. The US Dollar index depreciated 4.55% MTD and 8.31% YTD. The US greenback had its biggest monthly decline against the Japanese Yen since July 2024 and the Euro since November 2022. US consumer confidence slumped to its lowest level in nearly five years in April on growing concerns over tariffs.
After Q1 returns for the Russell 3000 Style indexes of Growth and Value came in at -10.14% and +1.12%, they continued to trade mixed in April returning +1.70% and -3.23%, respectively. Seven of the eleven sectors posted losses in April, but Technology (+1.83%) and Consumer Staples (0.29%) led, while Energy stocks took the worst of it – declining 13.82%. Crude oil prices posted their largest monthly drop (-18.56%) in nearly 3 ½ years after Saudi Arabia signaled a move toward producing more and expanding its market share, while the global trade war eroded the outlook for fuel demand. As mentioned, US President Donald Trump announced tariffs on all US imports on April 2 and China responded with its own levies, stoking a trade war between the world’s top two oil-consuming nations. The world will be watching to see if diplomacy may offer tariff relief in the months ahead.
China was the largest drag on Emerging Markets returns this month falling 4.55%, with MSCI Pakistan being the worst international performer in April, off 7.38% following a deadly militant attack in Kashmir with potential escalations between the country and India adding to geopolitical risk. On the other side of the returns coin, MSCI Mexico was the best performing country in April rallying 12.61% to bring its YTD return to 21.85% — making it the largest positive contributor to MSCI EM returns in 2025.
Gold surpassed $3,500/oz on April 22nd, before pulling back from its record high. It still posted its fourth consecutive month of gains, climbing 5.29% in April, to bring YTD gains to 25.31% making it one of the best performing asset classes in 2025. Non-yielding bullion, a safeguard against political and financial turmoil, also thrives in a low-interest rate environment. Meanwhile, gold-miner stocks climbed 6.61% MTD and are up 44.53% YTD, but remain off over 26% from their all-time highs reached back in September 2011.
Overall, the diversified Bloomberg Commodity index slumped 4.81% MTD with its heavy weighting in oil but remains up 3.64% YTD in large part due to its exposure precious metals. Bitcoin, which is often referred to as “digital gold”, rallied 14.75% in April to bring YTD returns into the black at 0.93%.
Disclosure Statement
Perigon Wealth Management, LLC (‘Perigon’) is an independent investment adviser registered under the Investment Advisers Act of 1940. More information about the firm can be found in its Form ADV Part 2, which is available upon request by calling 415-430-4140 or by emailing compliance@perigonwealth.com
Performance
Past performance is not an indicator of future results. Additionally, because we do not render legal or tax advice, this report should not be regarded as such. The value of your investments and the income derived from them can go down as well as up. This does not constitute an offer to buy or sell and cannot be relied on as a representation that any transaction necessarily could have been or can be affected at the stated price.
The material contained in this document is for information purposes only. Perigon does not warrant the accuracy of the information provided herein for any particular purpose.
Additional Information regarding our investment strategies, and the underlying calculations of our composites is available upon request.
Data Source: Bloomberg Pricing Data, as of April 30, 2025.
Annual Form ADV
Every client may request a copy of our most current Form ADV Part II. This document serves as our “brochure” to our clients and contains information and disclosures as required by law.
Perigon Wealth Management, LLC is a registered investment advisor. Information in this message is for the intended recipient[s] only. Different types of investments involve varying degrees of risk. Therefore, it should not be assumed that future performance of any specific investment or investment strategy will be profitable. Please click here for important disclosures or visit our website at perigonwealth.com.”