Global stocks popped 5.75% in May, marking the MSCI All Country World Index’s (ACWI) best monthly performance since November 2023 when it surged 9.23%. The bulk of the global equity index gains came on May 12th after the US and China agreed to dramatically lower tariffs for 90 days. The deal slashed US tariffs on Chinese goods from 145% to 30%, and Beijing said it would cut its blanket tariffs on American products from 125% to 10%. After global equity markets closed for the day on May 28th, a US trade court ruling blocked most of the tariffs initiated this year, only to have a federal appeals court pause the lower court’s ruling the following day. The month closed with the White House accusing China of violating the recently reached agreement, and Treasury Secretary Scott Bessent said that trade talks between the countries were “a bit stalled.” The involvement of the courts along with tensions between the two largest global economies add new wrinkles to an already complex and seemingly fragile situation. The month also highlighted fiscal deficit and inflation concerns, but the ongoing geopolitical uncertainties of “reciprocal tariffs” continue to dominate headlines. Still, volatility declined, with the CBOE Volatility Index (aka, the VIX “fear index”) closing the month at 18.57, down 24.82% from the month prior.
Click the image to view the chart larger.
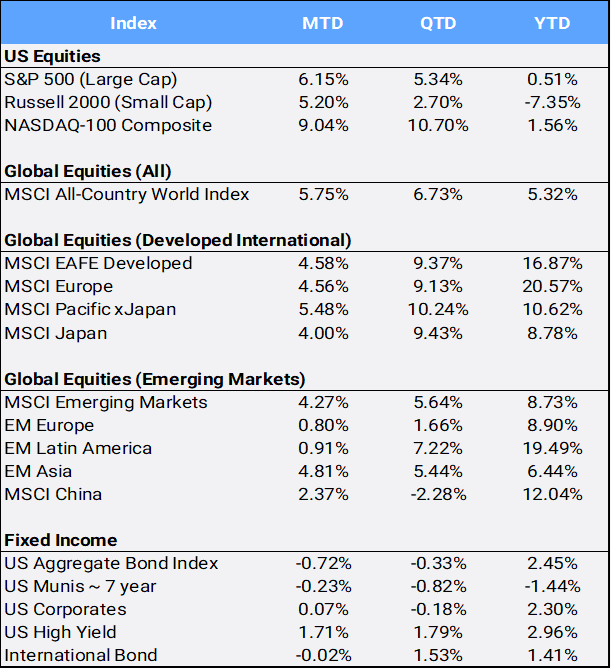
Source: Bloomberg Pricing Data, as of May 31, 2025
On May 16, 2025, Moody’s downgraded the US sovereign credit from its highest “Aaa” rating to “Aa1” due to concerns about the nation’s growing, $36 trillion debt. It is the last of the three major debt-rating agencies to lower the US from top-ratings, following downgrades by S&P Global in 2011 and Fitch Ratings in 2023. The downgrade may complicate President Trump’s efforts to cut taxes and Treasury Secretary Bessent’s goal to lower US government funding costs. Moody’s first gave the United States its pristine “Aaa” rating back in 1919.
US Treasury yields crept higher with the 2- and 10-year key rates closing May at 3.90% and 4.40% from April’s 3.60% and 4.16%, respectively. Following a disappointing treasury note auction, the 30-year yield even surpassed 5% before closing May at 4.93%. Minutes from the last FOMC meeting warned of “difficult tradeoffs” faced by the committee should inflation and unemployment start to rise in tandem.
The S&P 500 climbed 6.15% for the month marking the index’s best May since 1990, and brought YTD returns into the black. Also significant was the SPX’s first outperformance versus international markets after lagging for five straight months. Still, the US MSCI ACWI ex-US Index (that is the MSCI global stock index without US equities) made 11 new all-time highs this month and gained 4.58% to bring YTD returns to 14.03% for both developed and emerging international stocks.
Ten of the eleven sectors gained in May led by Technology’s 9.93% gain. The same technology giants that helped drag the S&P 500 to the brink of a bear market in April are giving the recovery in US stocks optimism. Chip giant Nvidia jumped after posting first-quarter results that exceeded expectations despite challenges related to China export rules. Meta Platforms raised its forecast for capital expenditures this year and Microsoft said it plans to increase spending in its next fiscal year, alleviating concerns that the companies might pull back on such outlays. Artificial intelligence continues to attract substantial investment, which may be a tailwind to growth sectors of the markets.
Meanwhile, Healthcare was the notable laggard falling 5.55% in May. The UnitedHealth Group fell 26.62% this month after facing a myriad of troubles including the departure of CEO Andrew Witty and suspending its annual forecast. Shares also plunged following a report that the Department of Justice is conducting a criminal investigation over possible Medicare fraud.
China was the largest drag on Emerging Markets returns this month falling 4.55% MTD, with MSCI Pakistan being the worst international performer in April, off 7.38%, following a deadly militant attack in Kashmir with potential escalations between the country and India adding to geopolitical risk. On the other side of the returns coin, MSCI Mexico was the best performing country in April, rallying 12.61% to bring its YTD return to 21.85% — making it the largest positive contributor to MSCI EM returns in 2025.
Gold surpassed $3,500/oz on April 22nd before pulling back from a record high but still managed to post four months of gains with its narrow 0.02% return for May to bring YTD gains to 25.33% making it one of the best performing asset classes so far in 2025. Meanwhile, gold-mining stocks climbed 3.35% MTD and are up 49.37% YTD, but remain off almost 24% from their September 2011 all-time highs. Other precious metals with more industrial usage include silver and copper, which gained 1.12% and 1.49% MTD and are up 14.12% and 16.17% YTD, respectively. Oil closed above $60, finishing at $60.79/barrel, up 4.43% MTD, but remains down 15.24% on the year. Last, Bitcoin, often referred to as “digital gold”, made an all-time high of $111,092.22 per coin on May 22nd, and managed to gain 10.59% in May, bringing YTD gains to 11.61%.
Disclosure Statement
Perigon Wealth Management, LLC (‘Perigon’) is an independent investment adviser registered under the Investment Advisers Act of 1940. More information about the firm can be found in its Form ADV Part 2, which is available upon request by calling 415-430-4140 or by emailing [email protected]
Performance
Past performance is not an indicator of future results. Additionally, because we do not render legal or tax advice, this report should not be regarded as such. The value of your investments and the income derived from them can go down as well as up. This does not constitute an offer to buy or sell and cannot be relied on as a representation that any transaction necessarily could have been or can be affected at the stated price.
The material contained in this document is for information purposes only. Perigon does not warrant the accuracy of the information provided herein for any particular purpose.
Additional Information regarding our investment strategies, and the underlying calculations of our composites is available upon request.
Data Source: Bloomberg Pricing Data, as of May 31, 2025.
Annual Form ADV
Every client may request a copy of our most current Form ADV Part II. This document serves as our “brochure” to our clients and contains information and disclosures as required by law.
Perigon Wealth Management, LLC is a registered investment advisor. Information in this message is for the intended recipient[s] only. Different types of investments involve varying degrees of risk. Therefore, it should not be assumed that future performance of any specific investment or investment strategy will be profitable.