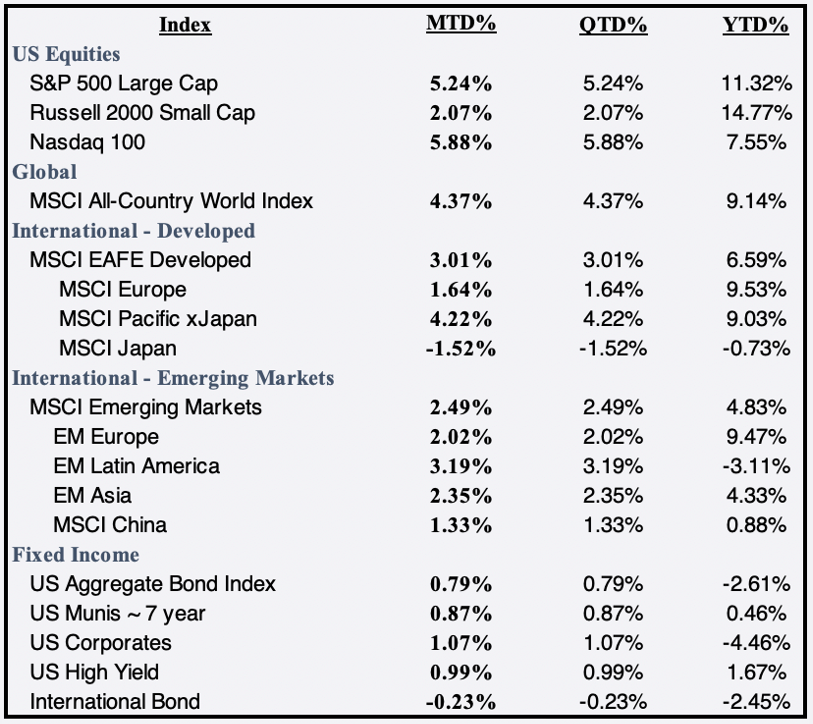
Global Equities reached an all-time high on April 29th, and the MSCI ACWI (All Country World Index) finished April up 4.37% to bring YTD returns to 9.14% in 2021. The S&P 500 posted notched its fourth consecutive positive month and its best monthly return since November, climbing 5.24% in April to 11.32% YTD. More than 87% of firms reporting so far for Q1 have exceeded their earnings estimates. First-quarter US Gross Domestic Product expanded at a 6.4% annualized rate as a rush of consumer spending helped the nation’s total output to near its pre-pandemic level.
Click the image to view the chart larger.
Source: Bloomberg Pricing Data, as of April 30, 2020
Rising vaccinations, faster job growth and two rounds of federal stimulus payments have combined to supercharge household spending. Pent-up consumer demand is likely driving the outsized reopening growth and is propelling prices upward at the same time producers are seeing materials shortages and supply-chain challenges. Expected inflation hit 2.4%, an eight-year high, due to a jump in oil and metals prices and positive economic surprises.
The FOMC left the Fed funds rate unchanged and maintained its existing asset purchase policy. It continued to emphasize the effects of COVID-19, while acknowledging that economic activity has strengthened due to vaccine progress and fiscal support. Chairman Jerome Powell observed that while inflation has increased, it was largely due to temporary factors. The ten-year treasury rate relaxed to 1.65% in April from 1.74% in March, in turn soothing returns in the US Aggregate Bond index, which steadied 0.79% in April following the index’s ¬worst quarterly return since September 1981.
While the Fed blames “transitory factors,” copper’s rise of 11.69% in April and 26.70% YTD might be sparking inflation fears. Lumber’s screeching 48.70% gain this month brought YTD gains to 71.86% as the commodity again hit an all-time high, pricing at $1,300 per 1,000 board feet. In addition, housing data continued to grab headlines, with the median selling price of $329,100 for existing U.S. homes up 17.2% YoY in March. While existing home sales actually dropped 3.7% last month due to supply being so limited, new home sales soared 20.7% MoM and 66.8% YoY despite the price increase in materials. Not surprisingly, real estate led all sectors for the month, gaining 8.28% in April, followed by financials’ climb of 6.57%.
All eleven sectors posted positive returns in April. While energy was the lowest performing sector this month, up 0.69%, it remains the best performing sector so far in 2021, gaining 31.60% YTD. Crude oil climbed 7.47% MTD.
Overseas, developed countries climbed 3.01% higher this month to bring the MSCI EAFE index to a 6.59% YTD. However, the Eurozone fell into a double-dip recession as the region sharing the euro currency shrank 0.60% in Q1 on slow vaccinations and tougher restrictions to stem a third coronavirus wave damaged the region’s 19 economies.
Meanwhile, emerging markets rose 2.49% in April while China equities only managed a 1.33% gain, but it was enough to pull the YTD return of the largest emerging market into the black at 0.88%. While China’s GDP climbed 18.3% in Q1, its record-breaking year-over-year figure has to factor that much of the economy was near completely shut down a year ago due to coronavirus fears.
Bitcoin blinked and posted its first monthly loss since September, falling 3.64% in April. Nevertheless, the asset often billed as “digital gold” is up 95.94% YTD.
Disclosure Statement
Perigon Wealth Management, LLC (‘Perigon’) is an independent investment adviser registered under the Investment Advisers Act of 1940.
Performance
Past performance is not an indicator of future results. Additionally, because we do not render legal or tax advice, this report should not be regarded as such. The value of your investments and the income derived from them can go down as well as up. This does not constitute an offer to buy or sell and cannot be relied on as a representation that any transaction necessarily could have been or can be affected at the stated price.
The material contained in this document is for information purposes only. Perigon does not warrant the accuracy of the information provided herein for any particular purpose.
Additional Information regarding our investment strategies, and the underlying calculations of our composites is available upon request.
Data Source: Bloomberg Pricing Data, as of April 30, 2021.
Annual Form ADV
Every client may request a copy of our most current Form ADV Part II. This document serves as our “brochure” to our clients and contains information and disclosures as required by law.
Perigon Wealth Management, LLC is a registered investment advisor. Information in this message is for the intended recipient[s] only. Different types of investments involve varying degrees of risk. Therefore, it should not be assumed that future performance of any specific investment or investment strategy will be profitable. Please click here for important disclosures.”
