- Global stocks soared 10.17% in April, following their 7.18% tumble in March, to close at an all-time high and bring their 2026 YTD return into the black at 6.65%. It was the MSCI All Country World Index’s (ACWI) best month since November 2020 and fifth largest monthly increase since its inception in 1998. US equities were the largest contributor to April returns shaking off worries of the conflict with Iran, oil price volatility, and inflation jitters, thanks to strong corporate earnings and robust economic growth. The S&P 500, in a dramatic turnaround, neared correction territory last month (-10%) subsequently reached seven new record closing highs before closing April up 10.42%. This was its latest all-time high while also closing above the 7200 milestone for the first time ever.
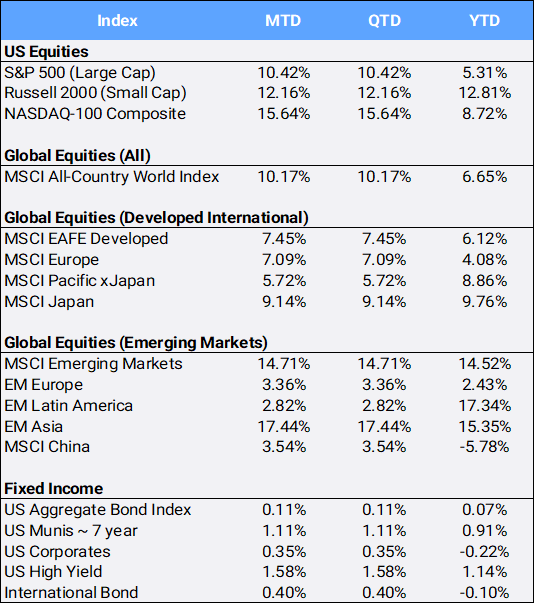
Source: Bloomberg Pricing Data, as of April 30, 2026
Click image to enlarge
- The CBOE S&P Volatility Index (VIX), often referred to as “the fear index”, traded as high as 31.01 on March 27th, but fell 33.11% MTD to close the month at 16.89 as strong earnings helped overcome investor nerves on geopolitics and inflationary concerns. Still, the VIX is up 12.98% on the year after beginning 2026 at a relatively complacent 14.95. One would think that the war in Iran, oil prices over $100 per barrel, sticky inflation, uncertainty at the Fed, and expectations that higher rates will persist, would be headwinds to equity prices, yet stocks just shrugged these off – as US growth remains strong with Q1 GDP expanding 2.0% from Q4 2025’s 0.5% increase.
- The personal consumption expenditures (PCE) price index, the Federal Reserve’s preferred measure of inflation in the economy, rose 0.7% in March, putting the annual inflation rate at 3.5%. In his final policy review speech as US Federal Reserve Chairman, Jerome Powell said, “This is, and will be, a very normal, standard kind of transition process” while conveying his regards to Kevin Warsh, US President Donald Trump’s pick as successor. Powell reminded investors that the Fed “exists for one fundamental purpose: to foster the economic conditions in which American families and businesses can thrive — stable prices, a strong job market and a financial system they can depend on”.
- As expected, the Fed held its key rate steady, but policy voting was more divided than in past meetings. Meanwhile, Fitch Ratings is warning the US’s credit grade faces the challenges of a widening deficit that leaves its debt burden “far above” other nations that share its AA score. Its team forecasts that deterioration is likely in the US fiscal position due to tax cuts in the One Big Beautiful Bill Act, despite offsets from tariff revenues. Fitch last downgraded the US back in August 2023 to AA+, citing concerns about the then political stalemate over the debt ceiling that nearly took the nation to the brink of a default.
- Nine of 11 sectors gained in April, with energy (-3.46%) and healthcare (-0.45%) the only detractors. Communications (18.54%) and technology (17.47%) led after stellar earnings boosted share prices. Tech’s April gain was its best MTD since October 2002. Nvidia was the largest contributor to ACWI returns, gaining 14.43%. Still, the rally in tech was broad, with the Philadelphia Semiconductor Index (SOX) up 38.42% MTD. Alphabet was the 2nd largest, up 33.82% MTD, its best month since October 2004. The Google parent reported high demand for its cloud and artificial intelligence offering, which helped convince investors that unprecedented infrastructure investment is paying off. Amazon was the next largest contributor, gaining 27.27% in its best month since 2007, as it spends rapidly to expand its data center capacity to meet demand for AI computing power – which has powered the fastest quarterly sales growth in its cloud unit in more than three years. Even “old tech” got into the action as Intel was the 10th largest contributor, as it gained 114.09% in April, its best month on record. On the style front, the Russell 3000 growth index gained 12.19% versus their value stock peers’ climb of “only” 8.12% this month to bring their YTD returns to 1.34% and 9.99% respectively.
- Behind the US, South Korea (38.21%), Taiwan (26.22%), and Japan (9.14%) were the next most impactful contributors to ACWI’s impressive April. It was South Korea’s KOSPI index’s best month in 28 years as tech optimism triumphed over Iran war worries overseas as well. The index’s outsized gains have been driven largely by optimism around the artificial intelligence boom, with semiconductor heavyweights SK Hynix (64.87%) and Samsung Electronics (36.21%) leading the charge. The rally was also supported by gains in energy storage, shipbuilding, defense, and nuclear power.
- The Bloomberg Commodity Index added 4.21% in April to bring its 2026 return to 29.65% YTD. Crude oil briefly traded above $117 per barrel on April 7th, before finishing the month at $105.07, a 3.64% MTD gain to bring its YTD return to 82.99%. News of a US-Iran ceasefire provided a strong catalyst for crude to come down off its earlier-in-the-month high. April ended with Trump saying he would not lift a naval blockade of Iran’s ports until he secures a deal with Tehran to address its nuclear program.
- Precious metals fell in April, as Gold and sliver slipped 1.08% and 1.89% respectively to bring YTD returns to 6.91% and 2.91%. Meanwhile, Bitcoin and Ethereum, sometimes billed as “digital gold and silver”, acted in divergent patterns from their physically referenced counterparts, gaining 12.13% and 7.47% MTD respectively, while lessening their 2026 declines to negative 12.76% and 23.98% YTD respectively.
-
Disclosure Statement
Perigon Wealth Management, LLC (‘Perigon’) is an independent investment adviser registered under the Investment Advisers Act of 1940. More information about the firm can be found in its Form ADV Part 2, which is available upon request by calling 415-430-4140 or by emailing [email protected]
Performance
Past performance is not an indicator of future results. Additionally, because we do not render legal or tax advice, this report should not be regarded as such. The value of your investments and the income derived from them can go down as well as up. This does not constitute an offer to buy or sell and cannot be relied on as a representation that any transaction necessarily could have been or can be affected at the stated price.
The material contained in this document is for information purposes only. Perigon does not warrant the accuracy of the information provided herein for any particular purpose.
Additional Information regarding our investment strategies, and the underlying calculations of our composites is available upon request.
Data Source: Bloomberg Pricing Data, as of April 30, 2026.
Annual Form ADV
Every client may request a copy of our most current Form ADV Part II. This document serves as our “brochure” to our clients and contains information and disclosures as required by law.
Perigon Wealth Management, LLC is a registered investment advisor. Information in this message is for the intended recipient[s] only. Different types of investments involve varying degrees of risk. Therefore, it should not be assumed that future performance of any specific investment or investment strategy will be profitable. Please click here for important disclosures or visit our website at perigonwealth.com.