Global equities continued their climb in August: The MSCI All-Country World Index posted a 6.12% return for the month, besting even the impressive 5.28% return in July. In the U.S., the large-cap S&P 500 Index hit an all-time high and posted its best August performance since 1986, gaining 7.01%. The Nasdaq 100 Index gained 11.05% in August and hit a record high. For the year to date, the three major indexes — the MSCI All-Country World Index, the S&P 500 and the Nasdaq — are all in positive territory, with growth of 4.75%, 8.34% and 38.68% respectively.
Global equities continued their climb in August: The MSCI All-Country World Index posted a 6.12% return for the month, besting even the impressive 5.28% return in July. In the U.S., the large-cap S&P 500 Index hit an all-time high and posted its best August performance since 1986, gaining 7.01%. The Nasdaq 100 Index gained 11.05% in August and hit a record high. For the year to date, the three major indexes — the MSCI All-Country World Index, the S&P 500 and the Nasdaq — are all in positive territory, with growth of 4.75%, 8.34% and 38.68% respectively.
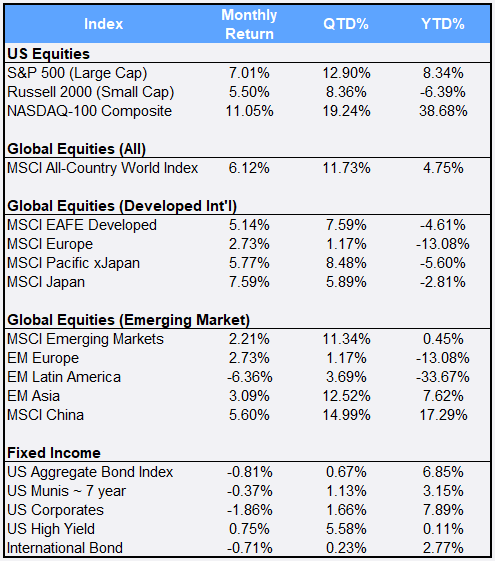
Source: Bloomberg Pricing Data, as of August 31, 2020
Traditionally, the Fed has had a dual monetary policy mandate of balancing inflation with unemployment. However, in his summer speech at Jackson Hole, Chairman Jerome Powell emphasized the latter as the central bank introduced a significant policy change, reaffirming its plan to keep short-term rates near zero even if inflation exceeds the 2% target. Investors moved confidently toward higher-risk assets, comforted by the updated Fed mission. Bond prices, meanwhile, declined in August for the first time after four straight months of gains: The Bloomberg Barclays US Aggregate Bond Index slipped 0.81%.
In international markets, developed equities rallied 5.14% this month to bring year-to-date returns to -4.61%. Emerging markets gained 2.21% in August to bring 2020 returns into the black at 0.45%. MSCI’s largest “emerging market” country, China, gained 5.60% in August to bring its 2020 year-to-date return to 17.29%. The U.S. dollar, which suffered its worst monthly depreciation in a decade in July, continued to slump in August, falling 1.29% against a basket of international currencies.
Increased volatility is typically negatively correlated with equity market gains, so it was very unusual to see the CBOE/S&P Volatility Index — also called the VIX or “fear gauge” — gain 7.97% in August alongside such strong equity market performance. An increase in options premiums suggests that traders are willing to pay more to insure their portfolios amid a range of uncertainties in the months ahead — a list that includes possible stimulus spending, the U.S. presidential election and the possible introduction of a COVID-19 vaccine.
Following gold’s 10.70% gain in July, its best monthly performance in nearly a decade, the precious metal slipped 0.41% in August. Copper and silver, however, gained 6.03% and 15.39% respectively, hitting all-time highs. Both are viewed as industrial components as well as precious metals. The metals have already drawn considerable safe-haven flows as investors fret about the pandemic’s global economic implications.
Disclosure Statement
Perigon Wealth Management, LLC (‘Perigon’) is an independent investment adviser registered under the Investment Advisers Act of 1940.
Performance
Past performance is not an indicator of future results. Additionally, because we do not render legal or tax advice, this report should not be regarded as such. The value of your investments and the income derived from them can go down as well as up. This does not constitute an offer to buy or sell and cannot be relied on as a representation that any transaction necessarily could have been or can be affected at the stated price.
The material contained in this document is for information purposes only. Perigon does not warrant the accuracy of the information provided herein for any particular purpose.
Additional Information regarding our investment strategies, and the underlying calculations of our composites is available upon request.
Data Source: Bloomberg Pricing Data, as of August 31, 2020.
Annual Form ADV
Every client may request a copy of our most current Form ADV Part II. This document serves as our “brochure” to our clients and contains information and disclosures as required by law.
Perigon Wealth Management, LLC is a registered investment advisor. Information in this message is for the intended recipient[s] only. Different types of investments involve varying degrees of risk. Therefore, it should not be assumed that future performance of any specific investment or investment strategy will be profitable. Please click here for important disclosures.”
