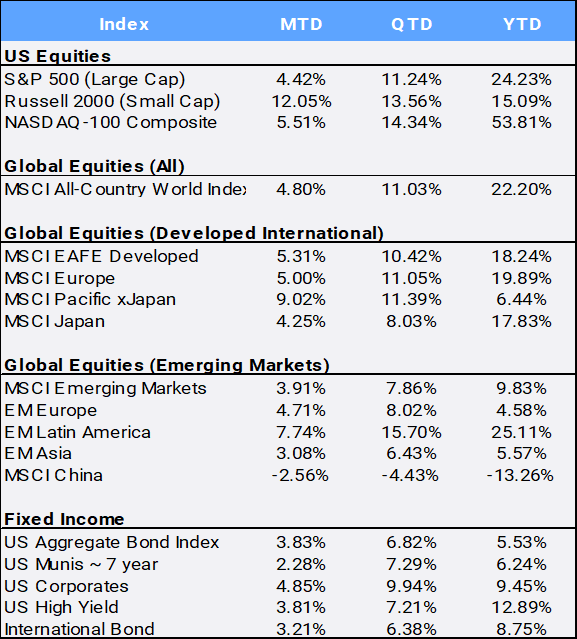
Global stocks finished 2023 with a nine-week winning streak, ending December up 4.80%, a gain of 11.03% for the fourth quarter and up 22.20% for the year. The MSCI All Country World Index (ACWI) finished the year less than 1% from its all-time high of January 4th, 2022.
Click the image to view the chart larger.
Source: Bloomberg Pricing Data, as of December 31, 2023
In the US, stocks bounced back in 2023 after a rough 2022, but it was an uneven story. The S&P 500 closed out the year with nine weeks of consecutive gains – its first such finale in nearly 20 years – for a 24.23% gain for the year. This reversed the damage of 2022 when the S&P plunged 19.44%, its worst annual return since 1945. The Nasdaq 100 soared 53.81%, its best annual return since 1999 when the dot-com bubble peaked. The small cap Russell 2000 achieved nearly all of its 15.09% yearly gain in the final two months. The late-year rally in US equities was precipitated by a sharp drop in interest rates and inflation expectations, but the indices exploded upward after the Federal Reserve announced a dovish pivot at the December meeting – indicating potential interest rate decreases in 2024 following its aggressive rate increases of 5.25% since 2022 in its battle with inflation.
The growth in stocks was largely driven by the buzz surrounding artificial intelligence (AI) fueled huge annual gains for the “Magnificent 7” stocks: Apple (+48%), Microsoft (+57%), Amazon (+81%), Alphabet (+58%), Nvidia (+239%), TSLA (+102% and Meta (+194%). However, the “average stock”, as measured by the equal-weight S&P500 index (SPW), only gained 11.56% on the year. Viewed from a sector perspective, global value stocks had outperformed global growth stocks by 20.98% in 2022, but that trend reversed in 2023: the MSCI World Value gained only 8.67% compared to the MSCI World Growth Index’s 35.95% gain. Still, in a year that saw stocks overall climb, it was evident that market fears subsided as the CBOE S&P Volatility Index (VIX) eased 42.55% to a complacent 12.45 after starting the year at 21.67.
Overseas, the MSCI EAFE developed countries index gained a solid 18.24% for the year. Inflation in the UK finally fell below 4% YoY in November, and the larger-than-expected drop fueled speculation that the Bank of England may cut interest rates in 2024. That said, fears of recession were still prevalent in the UK and Eurozone sentiment surveys. Finally, the Bank of Japan left policy unchanged at its final meeting of the year, looking for signs of wage growth before exiting negative interest rates. Japan’s inflation indicators have been heading lower, with November’s core CPI declining to +2.7% YoY. Japan was the largest positive contributor to international market returns, gaining 17.83% YTD. International markets were further boosted by a depreciating US dollar, which slipped -1.33% I 2023 for its first loss since 2020 against a basket of international currencies.
Emerging Markets managed a 9.83% return for 2023 despite China’s continued economic struggles. While Hong Kong posted the worst developed market return, falling -17.83%, China was the emerging markets laggard, declining 13.26%. The People’s Bank of China (PBOC) stood pat on its benchmark lending rates, but economists expect further monetary easing in the new year. On the other end of the spectrum, India was the largest contributor to EM returns, as the local stock market increased 20.81% in 2023 – partially aided by a growing trend of US companies diverting investment from China to India to build up supply chain resilience. Political tensions with wars in Israel/Gaza and Ukraine/Russia have prompted caution when investing in EM, holding back returns.
Technology and Communications were 2023’s stock sector standouts, jumping 56.13% and 53.04% respectively, while Energy, Staples and Utilities were the laggards, declining 0.59%, 0.79%, and 7.08% respectively. Utilities as a capital-intensive industry that typically uses high levels of debt, has been punished by rising interest rates and increased borrowing costs. Energy stocks were hurt by oil prices that slumped 10.73% in 2023.
Commodities markets reflected declining inflation, as the diversified Bloomberg index slipped 7.91% this year. Corn and wheat prices posted their largest annual losses since 2013, falling 31% and 23%. Gold, however, shone bright this past year; it gained ,13.10% and surpassed $2,000/oz in its best year since 2020.
Across the globe, slowing inflation numbers caused bond yields to plunge, as many central banks indicated more dovish policies ahead and risk asset prices surged to end the year. Global bonds were not to be left out of the rally, as the US Aggregate (AGG) and international bonds climbed an impressive 6.82% and 6.38% in Q4 to bring YTD gains to 5.53% and 8.75% respectively.
The 10-Year US Treasury yield, which rose unrelentingly from 3.25% in April to nearly 5% in October, finished the year almost exactly where it began, at 3.88%. Still, the yield curve remains inverted; the 2-year yield ended 2023 at 4.25% after starting the year at 4.43%. On the inflation front, November’s Personal Consumption Expenditures (PCE) price index fell 0.1%, its first monthly decline since April 2020, while the annual gain in prices fell to 2.6% from 2.9%. The Fed held rates steady throughout the quarter, but at the final meeting of the year policymakers noted that they expect to cut rates three times next year.
Last, Bitcoin jumped from $16,579 last January to end the year at $41,935.34 for a staggering +152.94% gain – touching a level not seen since April 2022 (although still off 19% from its all-time high in November 2021). US regulators are expected to soon approve the first spot bitcoin exchange-traded funds.
Disclosure Statement
Perigon Wealth Management, LLC (‘Perigon’) is an independent investment adviser registered under the Investment Advisers Act of 1940. More information about the firm can be found in its Form ADV Part 2, which is available upon request by calling 415-430-4140 or by emailing [email protected]
Performance
Past performance is not an indicator of future results. Additionally, because we do not render legal or tax advice, this report should not be regarded as such. The value of your investments and the income derived from them can go down as well as up. This does not constitute an offer to buy or sell and cannot be relied on as a representation that any transaction necessarily could have been or can be affected at the stated price.
The material contained in this document is for information purposes only. Perigon does not warrant the accuracy of the information provided herein for any particular purpose.
Additional Information regarding our investment strategies, and the underlying calculations of our composites is available upon request.
Data Source: Bloomberg Pricing Data, as of December 31, 2023.
Annual Form ADV
Every client may request a copy of our most current Form ADV Part II. This document serves as our “brochure” to our clients and contains information and disclosures as required by law.
Perigon Wealth Management, LLC is a registered investment advisor. Information in this message is for the intended recipient[s] only. Different types of investments involve varying degrees of risk. Therefore, it should not be assumed that future performance of any specific investment or investment strategy will be profitable. Please click here for important disclosures.”