Global Market Commentary at a Glance
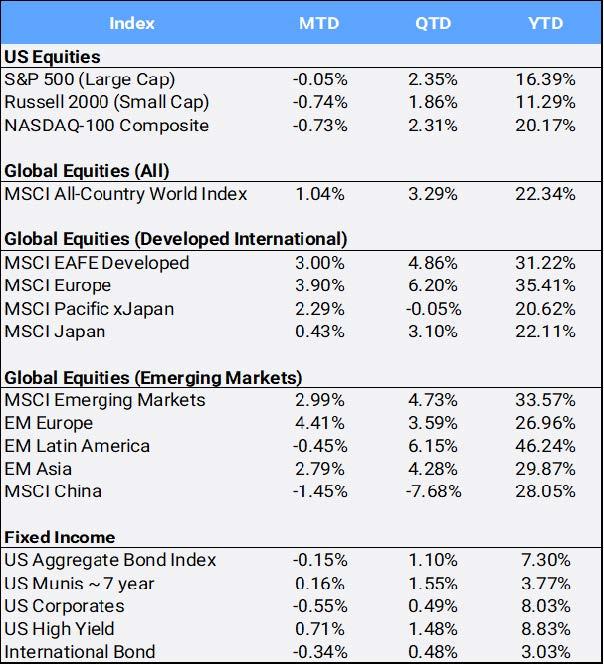
Global stocks ended the year up 22.34%
S&P 500 gained 16.39%
International stocks had their best year since 2009
Silver surged 148% YTD
Gold rose 65% YTD
U.S. bonds returned 7.30%, their best year since 2020
Bitcoin fell 6.47%
Oil dropped nearly 20%
Source: Bloomberg Pricing Data, as of December 31, 2025
Click image to enlarge
Global stocks end 2025 with 56 all-time highs making it the strongest year since 2019
Global stocks gained 1.04% in December to bring their QTD and YTD returns to 3.29% and 22.34% respectively. It was the MSCI All Country World Index’s (ACWI) best annual performance since 2019’s 26.60%. The global equity benchmark made 56 new all-time highs this year and finished just 0.78% off its all-time high made on December 26th – making for quite the holiday present for investors. It was the Index’s third consecutive year of gains, cumulatively returning 75.65% over that span, following 2022’s ugly 18.36% down-year.
International markets lead global gains as U.S. stocks trail
International markets powered the ACWI higher in 2026 with EAFE developed markets up 3.00% MTD, 4.86% QTD and 31.22% YTD (its best year since 2009 following the Great Financial Crisis) and Emerging Markets up 2.99%, 4.73%, and 33.57% (their best year since 2017) correspondingly.
Large caps beat small caps while average stocks lagged
In the US, the large cap S&P 500 outgained its smaller peers, as it returned 16.39% in 2025 compared to the S&P 400 mid cap and the Russell 2000 small cap’s annual 2025 gain of 5.90% and 11.29%, respectively. However, the average S&P stock as measured by the SPW equal-weight index was “only” up 9.34% this year.
Just two tech giants drove most of the S&P 500’s gains
The often-quoted “Magnificent Seven” stocks were fueled by the allure of artificial intelligence, although some valuation concerns crept in towards year-end given those companies’ massive capital outlays. The “Mag 7” contributed considerably, accounting for approximately 43% of the S&P 500 YTD return. However, only two were truly magnificent in 2025: Alphabet (65.78%) and Nvidia (38.88%) as the remaining were underperformers: Microsoft (14.74%), Meta (12.74%), Tesla (11.36%), Apple (8.56%) and Amazon (5.21%).
All sectors finished higher, but tech and communications did the heavy lifting
All eleven sectors climbed this year, with technology and communications as the dominant ones, gaining 24.72% and 23.08%, respectively, in 2025. Real estate and consumer staples were the laggards, up 2.70% and 1.61% respectively.
Volatility faded by year-end after a sharp spring selloff
The CBOE S&P Volatility Index (VIX), often referred to as “the fear index”, started the year at 17.35, but eased its way to finish 2025 down 13.83% to a relatively mild 14.95. However, 2025 will likely be best remembered for its April spike above 60 during the tariff-induced equity market swoon that saw the S&P nearly fully enter a bear market status with its 18.90% drawdown touched on April 8th (a bear market is defined as a drawdown of 20% or more).
Bonds rebound in 2025 as rate cuts come into focus
US Bonds slipped 0.15% in December but gained 1.10% in Q4 to finish the year at 7.30% – its best performance since 2020. Prices and yields move in opposite directions. US Treasury yields trended lower after peaking early in the year while the spread between short-term and long-term rates increased meaningfully. The yield on two-year notes started the year at 3.61% to finish at 3.47% as investors priced this year’s three rate cuts from the Federal Reserve. Meanwhile, the 10- and 30-year yield began the year at 4.73% and 4.73% while ending the year at 4.17% and 4.84% as GDP growth was solid and inflation expectations remained elevated.
A weaker dollar fuels international stocks and precious metals
International stocks had the best outperformance versus U.S. stocks since 2009, partly responsible was a tumbling US dollar, which depreciated 1.14% in December, to bring its full year return versus a basket of international stocks to negative 9.37% YTD – its sharpest annual retreat in eight years. Further depreciation may be coming if the anticipated next US Fed Reserve Chief opts for further interest rate cuts and the Fed’s path continues to diverge from other international central banks. EM gains too might also spill over into next year as 17 of 23 Emerging market currencies were up against the dollar in 2025. Additionally, strong demand, a weaker dollar, political uncertainty and falling interest rates also fuel precious metals which posted blockbuster returns this year.
Gold and silver deliver historic gains as demand surges
Gold gained 1.89% MTD, 11.93% QTD, and 64.58% YTD, while silver gained 26.84%, 53.63%, and 147.95% correspondingly – their best annual performance since 1979 (!). The rally in gold has been supported by a multitude of factors, including the impact of US interest rate cuts, tariff tensions, and robust demand from exchange-traded funds and central banks. Meanwhile, silver’s stellar performance stemmed from a mix of low supply and high demand from India, as well as industrial needs and tariffs. Mining stocks also benefited from the “gold rush” as gold miners closed the year up 152.93%.
Bitcoin ends a volatile year lower after peaking in October
Bitcoin’s rollercoaster year ended with the largest cryptocurrency falling 3.59% in December to bring Q4 returns to negative 23.55%, and into the red YTD with a 6.47% decline in 2025. Its sharp drawdown escalated after prices reached a record high above $127,000 as recently as early October.
Commodities provide diversification, but energy drags returns
The diversified Bloomberg Commodity Index slipped 0.32% in December but still managed to gain 5.85% in Q4 to bring its annual return to 15.77% — helping investors looking to benefit from low correlated assets in diversifying traditional stocks and bonds. Both Sugar & Cocoa became “less sweet” this year as they fell 6.77% and 10.13% in Q4 to bring their annual returns to down 22.07% and 48.05% respectively. Oil prices also suffered to close out the year, falling 1.93% MTD, 7.94% QTD and 19.94% YTD in its worst drawdown since 2020 as expectations of oversupply increased in a year marked by wars, higher tariffs, increased OPEC+ output and sanctions on Russia, Iran and Venezuela. It was oil’s third straight year of losses, the longest such streak on record.
Disclosure Statement
Perigon Wealth Management, LLC (“Perigon”) is an independent registered investment adviser. Form ADV Part 2 is available upon request by calling 415-430-4140 or emailing compliance@perigonwealth.com. For additional disclosures, visit perigonwealth.com.
Past performance is not indicative of future results. Investments may lose value, and nothing contained herein should be construed as legal, tax, or investment advice, or as an offer or solicitation to buy or sell any security. Information is for educational purposes only and obtained from sources believed to be reliable, but its accuracy is not guaranteed.
Data Source: Bloomberg Pricing Data, as of December 31, 2025.