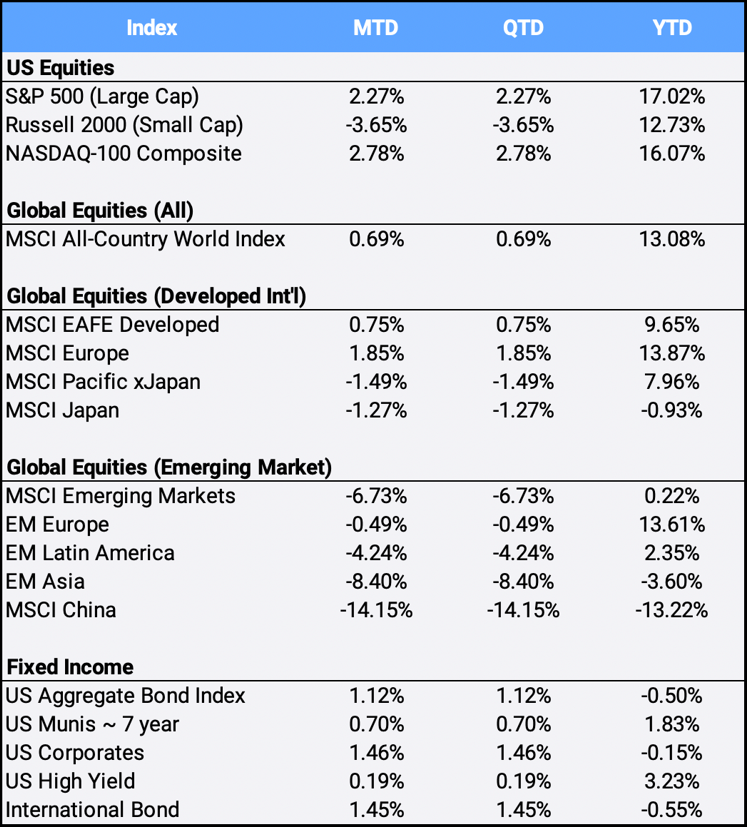
Global Equities advanced 0.69% in July to bring YTD gains to 13.08%. US stocks comprise more than 58% of the MSCI ACWI (All Country World Index), and the S&P 500 climbed 2.27% in July to mark its sixth straight monthly gain –its longest win streak since 2018. International stocks’ performance were mixed, as the MSCI EAFE Index of developed markets gained 0.75% while the MSCI Emerging Markets index fell -6.73% this month to bring their YTD returns to 9.65% and 0.22% respectively so far in 2021.
Click the image to view the chart larger.
Source: Bloomberg Pricing Data, as of July 31, 2020
China has the largest weight in the Emerging Market index at almost 35% and was the index’s worst performing country as Chinese equities got slammed -14.15% this month. American-listed Chinese stocks remained under pressure as the SEC has stopped processing UD IPO registrations of Chinese companies while it considers new disclosures. In Beijing, regulators continue to step up their oversight in sectors spanning from technology (data rights) to education (crackdown on private schooling offerings) to food delivery (requiring minimum wages). While the measures are aimed at improved social welfare, international investors got spooked and China 2021 returns now stand at -13.22% YTD.
Still, China leads global growth with its 7.9% increase in second quarter gross domestic product. This compares to Q2 GDP of 6.5% for the US, 2.0% for the European Union, and a -0.3% slip for Canada.
Treasury yields fell after the Federal Reserve indicated at its July Federal Open Market Committee meeting that it is in no hurry to tighten monetary policy. Fed Chairman Jerome Powell noted that while the economy has come a long way since the Covid-19 recession, it still has a way to go before the central bank considers adjusting its easy-money policies. As bond prices are inversely related to interest rates, the US Aggregate Bond Index and the International Bond Index both rallied 1.12% and 1.45% respectively in July.
The Fed’s accommodative stance sent the dollar tumbling, as the dollar index depreciated -0.28% in July against a basket of international currencies. Both gold and crude oil prices moved higher by 2.49% and 0.65% respectively this month. Inflation continues to persist as US core personal consumption expenditures (PCE) prices rose 3.5% YoY in June – its biggest move since 1991. Internationally, consumer price indexes in Australia, Germany and the European Union all overshot their consensus estimates.
The healthcare and real estate sectors led returns higher this month, posting gains of 4.90% and 4.64% respectively. On the other side of the coin, energy stocks were the worst performing sector, dropping -8.36% in July to snap a streak of eight-straight months of gains – its longest streak in over a decade. Still, the one-month drop didn’t derail energy from being the best performing sector of 2021 with its 33.08% YTD gain.
Despite trading below 30,000 for the first time since 2020 on July 20th, Bitcoin managed to rally 17.65% to finish July above 40,000 and up 17.65% on rumors that Amazon could accept it as payment. The asset billed as “digital gold” is up 40.33% YTD in a wild 2021, but still off its high of 63,410.29 on April 15th.
Disclosure Statement
Perigon Wealth Management, LLC (‘Perigon’) is an independent investment adviser registered under the Investment Advisers Act of 1940.
Performance
Past performance is not an indicator of future results. Additionally, because we do not render legal or tax advice, this report should not be regarded as such. The value of your investments and the income derived from them can go down as well as up. This does not constitute an offer to buy or sell and cannot be relied on as a representation that any transaction necessarily could have been or can be affected at the stated price.
The material contained in this document is for information purposes only. Perigon does not warrant the accuracy of the information provided herein for any particular purpose.
Additional Information regarding our investment strategies, and the underlying calculations of our composites is available upon request.
Data Source: Bloomberg Pricing Data, as of July 31, 2021.
Annual Form ADV
Every client may request a copy of our most current Form ADV Part II. This document serves as our “brochure” to our clients and contains information and disclosures as required by law.
Perigon Wealth Management, LLC is a registered investment advisor. Information in this message is for the intended recipient[s] only. Different types of investments involve varying degrees of risk. Therefore, it should not be assumed that future performance of any specific investment or investment strategy will be profitable. Please click here for important disclosures.”
