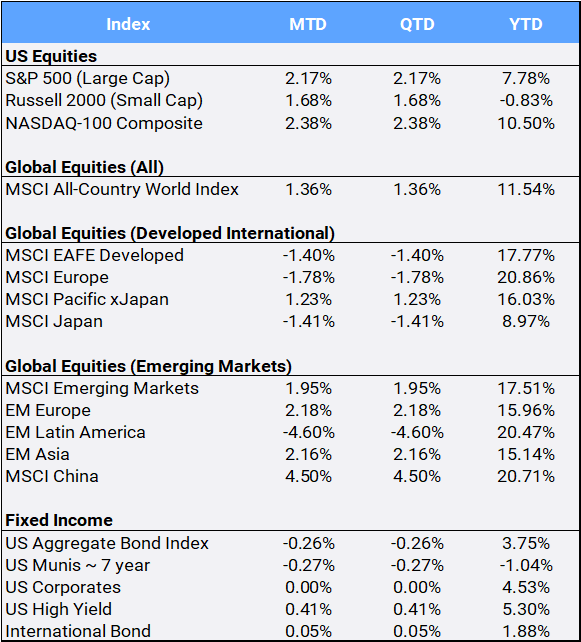
The MSCI All Country World Index’s (ACWI) made eight new all-time highs in July, bringing the 2025 total to 31, as global stocks gained 1.36% this month to bring YTD returns to 11.54%. The global benchmark has rallied 25.81% from its April 8th post-tariff-announcement low, when it was then down 11.34% YTD. Tariffs will likely continue to dominate headlines, as the White House extended its August 1st deadline for some partners. Major agreements were reached this month with the EU (15%), Japan (15%), UK (10%), and Vietnam (20%), while negotiations with China, India and Korea continue. President Donald Trump announced a 50% tariff on most Brazilian goods noting political reasons in lieu of economic ones, leaving questions about possible non-trade rationales going forward.
Click the image to view the chart larger.
Source: Bloomberg Pricing Data, as of July 31, 2025
Improved trade talks were evident in the CBOE S&P Volatility Index (VIX) closing slightly lower by 0.06% in July. The “fear index” has traded as high as 52.33 after starting the year at 17.35.
Over 67% of the S&P 500 companies have reported stronger than expected earnings, and the US large cap constituents are expected to set a new profit record, even as corporations appear to have mostly absorbed the tariff costs. Higher than expected earnings were reported by mega cap companies Microsoft, Nvidia, Meta, Amazon, and Apple. Both Microsoft and Nvidia became the first stocks to surpass $4 trillion in market capitalization. Large cap companies continue to outperform their smaller cap peers, as evident in the performance of the S&P 500 and Russell 2000 indexes: 2.17% and 1.68% MTD and 7.78% and -0.83% YTD returns, respectively.
The Federal Reserve decided to keep interest rates unchanged at its July Federal Open Market Committee (FOMC) meeting. In its first dissent since 1993, two FOMC members (Michelle Bowman and Christopher Waller) voted against the decision noting rising threats to the labor market. President Trump visited the Federal Reserve and escalated his pressure campaign against Chairman Jerome Powell. The June PCE price index revealed an uptick in headline inflation, rising 0.3% MoM and 2.6% YoY, while the core rate held steady at 2.8% YoY. Although tariffs have yet to show significant evidence in consumer price data, the latest wave of import duties may push prices beyond the Fed’s 2% inflation target. The US Aggregate Bond index slipped 0.26% in July.
Meanwhile, the US dollar posted its first monthly gain of the year against a basket of major currencies, appreciating 3.19% in July, underpinned by easing trade tensions, US economic resilience, and a hawkish Fed. Still, the greenback is down 7.85% YTD. The “One Big Beautiful Bill ” was signed into law on July 4th, shifting government spending priorities, making hefty tax cuts, and creating an expected increase of $3.4 trillion to the US deficit.
The MSCI ACWI ex US index that includes both international developed and emerging markets but excludes US stocks, slipped 0.29% in July mostly due to the appreciating dollar, but its YTD return remains strong at 17.56%. President Trump said the US would start imposing measures on Russia, including 100% secondary tariff penalties on its trading partners, if it does not progress on ending its war with Ukraine within the first two weeks in August, moving up an earlier 50-day deadline. The US has also warned China, the largest buyer of Russian oil, that it could face huge tariff consequences if it continues its purchases from Moscow. The threat of US sanctions on Russia helped support oil prices that climbed 6.37% in July, but remain in the red YTD, off 3.43%.
President Trump’s surprises continued in the precious metals markets, as copper fell 14.32% in July after the president said the US would impose a 50% tariff on copper pipes and wiring. Copper prices overall are still in the black YTD, up 8.15%. Gold, which thrives in a low-interest rate environment as it is a non-yielding asset, slipped 0.40% with the Fed holding rates still, but remains up 25.35% YTD. The diversified Bloomberg Commodity Index slipped 0.45% in July to bring its YTD return to 5.05%.
Sector returns were mixed with only five of the eleven showing gains in July, led by Utilities and Technology which climbed 4.94% and 3.63%, respectively. IPO momentum continued with Figma’s July 31st listing, and its 250% price “pop” on its first day of trading exemplified the strength of investor appetite for new technology listings. On the other side of the return coin, healthcare was the worst performing sector both MTD and YTD, dropping 3.26% and 4.33%, respectively. President Trump sent letters to the CEOs of 17 major pharmaceutical companies demanding “binding commitments” to slash prescription drug prices.
Last, US Congress passed the GENIUS Act (Guiding and Establishing National Innovation for US Stablecoins) on July 17th, which is designed to provide a legal framework surrounding the issuance and regulation of “payment stablecoins” that are defined as “digital assets”. Bitcoin, the world’s largest cryptocurrency, traded as high as $122,838 and gained 8.26% this month to bring 2025 returns to 24.30%.
Disclosure Statement
Perigon Wealth Management, LLC (‘Perigon’) is an independent investment adviser registered under the Investment Advisers Act of 1940. More information about the firm can be found in its Form ADV Part 2, which is available upon request by calling 415-430-4140 or by emailing compliance@perigonwealth.com
Performance
Past performance is not an indicator of future results. Additionally, because we do not render legal or tax advice, this report should not be regarded as such. The value of your investments and the income derived from them can go down as well as up. This does not constitute an offer to buy or sell and cannot be relied on as a representation that any transaction necessarily could have been or can be affected at the stated price.
The material contained in this document is for information purposes only. Perigon does not warrant the accuracy of the information provided herein for any particular purpose.
Additional Information regarding our investment strategies, and the underlying calculations of our composites is available upon request.
Data Source: Bloomberg Pricing Data, as of July 31, 2025.
Annual Form ADV
Every client may request a copy of our most current Form ADV Part II. This document serves as our “brochure” to our clients and contains information and disclosures as required by law.
Perigon Wealth Management, LLC is a registered investment advisor. Information in this message is for the intended recipient[s] only. Different types of investments involve varying degrees of risk. Therefore, it should not be assumed that future performance of any specific investment or investment strategy will be profitable.