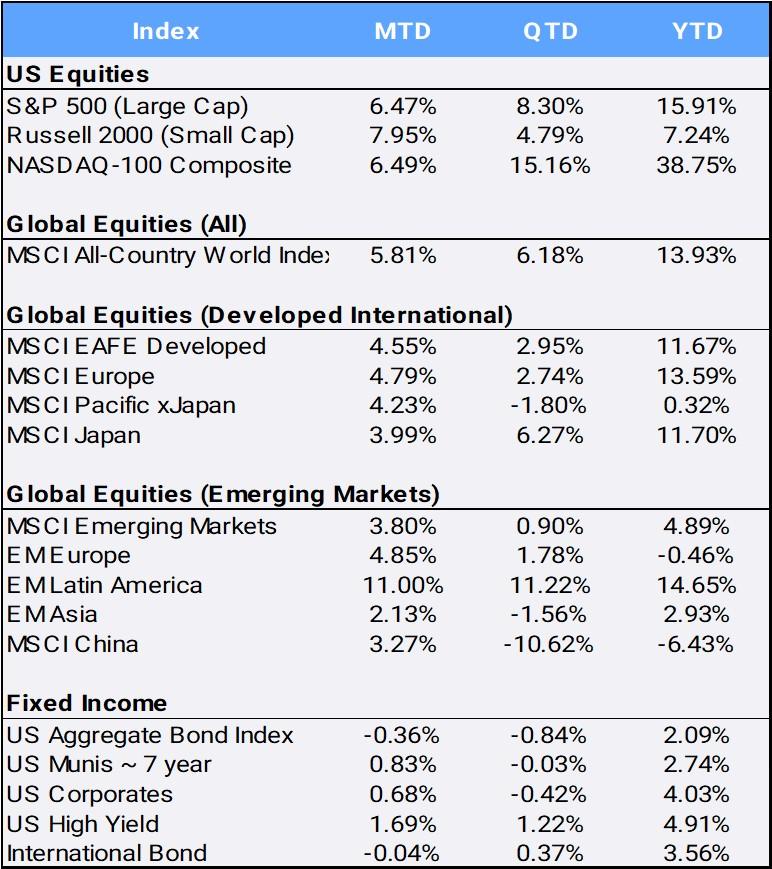
Global stocks rallied to finish the month up 5.81% and the quarter up 6.18%, and closing the first half of 2023 up 13.93%. It was the second-best start to a year since the inception of the MSCI All Country World Index (ACWI). Investors applauded robust economic data and cooler-than-expected inflation numbers coming in from most of the globe, renewing confidence for a possible soft-landing for the world economy. In the U.S., the big tech growth companies that took a beating in 2022 made a broad comeback as the promise of artificial intelligence and hopes for an end to the Federal Reserve’s rate hiking campaign helped lift major technology players to astonishing heights. The Nasdaq 100 mega-cap index was up 38.75% YTD –after ending 2022 down -32.97%,– while the broader Nasdaq composite index that tracks more than 2,500 stocks gained 31.73%, marking its best start of the year since 1983. The SP500 index meanwhile closed out June up +6.47% and up 16% for the first half.
Click the image to view the chart larger.
Source: Bloomberg Pricing Data, as of June 30, 2023
Apple became the first ever company to hit a $3 trillion market valuation at the close of the half, after becoming the first to reach $1 trillion company in 2018 and $2 trillion in 2020. Today, there are now five companies with more than $1 trillion in valuation: Microsoft, Tesla, Meta, Amazon, and Nvidia – with the last surpassing the milestone just last month. Mega-cap tech firms have been benefiting from the surge in artificial intelligence potential.
For June, all 11 stock sectors posted gains, ranging from Consumer Discretionary – up +12.29%– to Utilities with a +1.6%. For the first half, seven of the 11 sectors have gained, led by Technology (up 40.44% YTD), Consumer Services (up 36.39%), and Consumer Discretionary (32.27%). Laggards were Utilities (-5.69% YTD), Energy (-5.45%) and Health Care (-1.48%).
For style investing, global growth stocks have exhibited strong resilience after lagging their value counterparts in 2022. Last year, value stocks finished down only -8.77% whereas growth stocks were off -29.75%. However, this year, growth stocks have rallied an impressive +26.47% so far in 2023 versus their value counterparts’ +2.45% YTD gain.
Overseas, developed markets gained +11.67% in the first half of the year, led by Ireland (up +25.36% YTD) and offset by Norway (down -11.95% YTD). The broad emerging market index is up 4.89% so far in 2023, led by Greece (up +37.71% YTD) with Thailand (down -11.06% YTD) the first-half laggard.
China, comprising almost 30% of MSCI Emerging Markets, has been the index’s largest drain in the first half of this year, losing -6.43% YTD. The much anticipated “China Reopening,” following draconian measures during its “zero-COVID” policy, fizzled as factory activity shrunk for the third consecutive month and stocks fell more than 20%, from January highs.
In commodity markets, the broad-based diversified index gained 4.04% in June, but remains off -7.79% YTD, following its impressive 16.09% gain in 2022. As noted above, energy stocks have lagged in the first half of 2023, with oil as a contributing factor. Crude oil, which traded as high as $130/barrel in 2022, finished last year at $80.26. In the first half, crude oil is off -11.99% YTD, finishing the second quarter at $70.64.
After 10 rate hikes in the past year through May, the US Federal Reserve paused at its June meeting to digest additional data. However, Fed officials warned that holding its benchmark overnight interest rate firm at upcoming meetings does not necessarily mean that it is done in its tightening monetary policy. That led the U.S. dollar to depreciated -1.36% in June, bringing its YTD depreciation to -0.59% against a basket of international currencies.
Bond markets, as measured by the U.S. Aggregate (AGG) and International Bond indexes, slipped slightly 0.36% and 0.04% in June to bring YTD returns to 2.09% and 3.56% respectively. With yields moving inversely to prices, both the US two- and ten-year rates increased to 4.90% and 3.84% by month’s end; the yield curve has been inverted all year.
The world’s largest crypto currency, Bitcoin, gained 12.07% in a month that saw a wave of applications to the SEC for a spot market Bitcoin ETF (including from Blackrock and Fidelity). Bitcoin closed out June at $30,477, finishing a highly volatile first half with a stunning 83.31% gain over the first six months of 2023.
Disclosure Statement
Perigon Wealth Management, LLC (‘Perigon’) is an independent investment adviser registered under the Investment Advisers Act of 1940. More information about the firm can be found in its Form ADV Part 2, which is available upon request by calling 415-430-4140 or by emailing compliance@perigonwealth.com
Performance
Past performance is not an indicator of future results. Additionally, because we do not render legal or tax advice, this report should not be regarded as such. The value of your investments and the income derived from them can go down as well as up. This does not constitute an offer to buy or sell and cannot be relied on as a representation that any transaction necessarily could have been or can be affected at the stated price.
The material contained in this document is for information purposes only. Perigon does not warrant the accuracy of the information provided herein for any particular purpose.
Additional Information regarding our investment strategies, and the underlying calculations of our composites is available upon request.
Data Source: Bloomberg Pricing Data, as of June 30, 2023.
Annual Form ADV
Every client may request a copy of our most current Form ADV Part II. This document serves as our “brochure” to our clients and contains information and disclosures as required by law.
Perigon Wealth Management, LLC is a registered investment advisor. Information in this message is for the intended recipient[s] only. Different types of investments involve varying degrees of risk. Therefore, it should not be assumed that future performance of any specific investment or investment strategy will be profitable. Please click here for important disclosures.”


