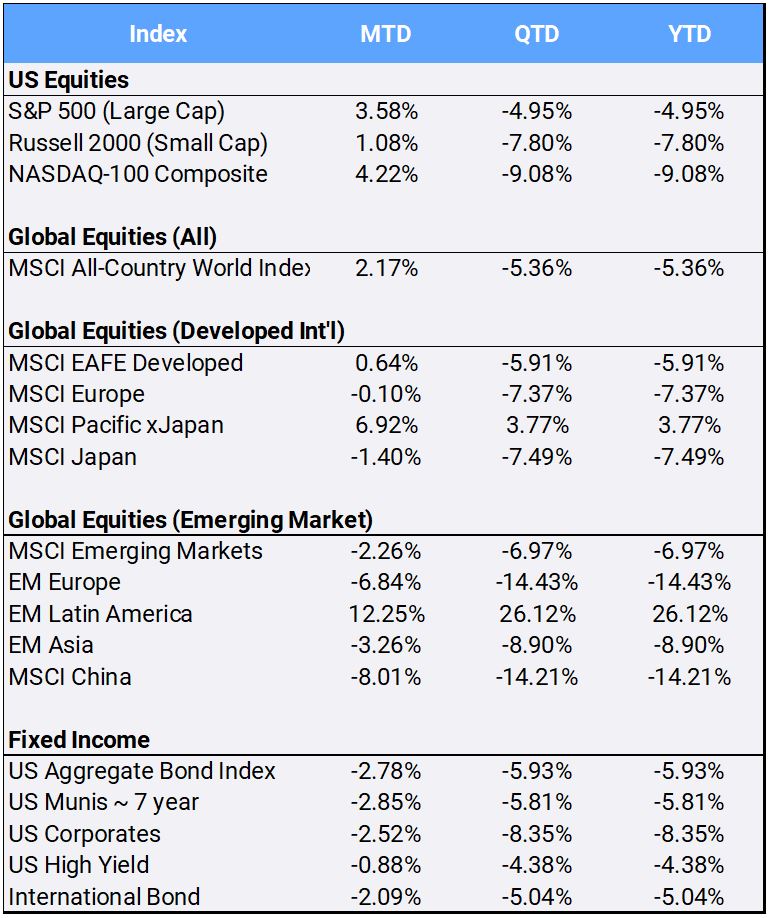
In their worst Q1 performance since 2020, global equities ended the first quarter down -5.36% despite rallying in March 2.17%. In the U.S., both the S&P 500 and Nasdaq indices posted their first quarterly loss in two years, returning -4.95% and -9.08% respectively. Markets have been shaken by the Russia-Ukraine war, global inflation and the inversion in the U.S. treasury yield curve between short- and long-term rates as the U.S. Federal Reserve began to raise interest rates. The CBOE Volatility Index, or VIX –often referred to as the “fear index”—spiked to 36.45 during March and closed the quarter at 20.56, a 19.40% jump from the outset of 2022.
Click the image to view the chart larger.
Source: Bloomberg Pricing Data, as of March 31, 2022
Internationally, the MSCI EAFE and MSCI Emerging Markets sank -5.91% and -7.49% respectively for the quarter. Russian stocks resumed trading after a three-week trading halt, but still finished the quarter with the worst country return, falling -66.11% QTD. Stocks in China fell 14.21% in the first quarter, with technology stocks being hit especially hard after the SEC added Chinese internet search engine giant Baidu to its growing list of ADRs that might get kicked off American stock exchanges.
Latin America, however, remains a bright spot in 2022, returning 26.12% in the first quarter. Brazil was the best performing country, gaining 34.29% as the Brazilian real appreciated more than 17% in Q1. In developed markets, Norway and Australia led first quarter EAFE returns, gaining 9.82% and 5.53% respectively.
Bonds prices sank lower in March, as central banks increased interest rates to combat the fastest rising inflation in decades (prices move inversely to interest rates). The U.S. International and Aggregate Bond indices returned -2.78% and -2.09% this month, ending the quarter down -5.93% and -5.04% respectively, in the U.S. bond market’s worst quarterly return since 1980.
The U.S. 2-year treasury rate jumped more than 90 basis points in March to finish at 2.334% — its largest monthly jump since 1984. Meanwhile, the 10-year treasury rate moved to 2.331%; this inversion of the yield curve is a closely watched potential indicator of future recession.
The U.S. Federal Reserve’s preferred inflation gauge, the Core Personal Consumption Expenditure Price Index, jumped 5.4% year-on-year, its highest annual increase since 1983. Internationally, the war’s effects started to become evident in the economic figures coming from the U.K. and the Eurozone. The U.K. CPI registered an annual 6.2% rate in February and jumped 0.8% month-on-month on spiking energy costs; in Germany, producer prices skyrocketed nearly 26% YoY.
On a more positive note, the diversified Bloomberg Commodity Index posted its best quarter since 1990, returning 25.55% for the quarter. Crude oil jumped 33.33% in Q1. In response, on March 31st the White house announced it will release up to one million barrels per day of oil from the Strategic Petroleum Reserve for the next six months to help tamp down soaring gas prices. President Joe Biden sharply criticized the domestic energy industry for sitting on unused oil supply.
Of the stock market’s 11 sectors, only Energy and Utilities closed out the first quarter with gains, up 39.08% and 4.77% respectively. Communication Services, Consumer Discretionary, and Technology were the worst performing sectors, posting Q1 returns of -11.25%, -9.35%, and -8.51% respectively.
Gold, often seen as a haven in times of geopolitical turmoil, closed the quarter at $1,937.44 per ounce, gaining 1.49% in March to notch a Q1 return of 5.92%. Meanwhile, Bitcoin rallied 9.87% in March but remains down -1.22% for the year.
Disclosure Statement
Perigon Wealth Management, LLC (‘Perigon’) is an independent investment adviser registered under the Investment Advisers Act of 1940. More information about the firm can be found in its Form ADV Part 2, which is available upon request by calling 415-430-4140 or by emailing [email protected]
Performance
Past performance is not an indicator of future results. Additionally, because we do not render legal or tax advice, this report should not be regarded as such. The value of your investments and the income derived from them can go down as well as up. This does not constitute an offer to buy or sell and cannot be relied on as a representation that any transaction necessarily could have been or can be affected at the stated price.
The material contained in this document is for information purposes only. Perigon does not warrant the accuracy of the information provided herein for any particular purpose.
Additional Information regarding our investment strategies, and the underlying calculations of our composites is available upon request.
Data Source: Bloomberg Pricing Data, as of March 31, 2022.
Annual Form ADV
Every client may request a copy of our most current Form ADV Part II. This document serves as our “brochure” to our clients and contains information and disclosures as required by law.
Perigon Wealth Management, LLC is a registered investment advisor. Information in this message is for the intended recipient[s] only. Different types of investments involve varying degrees of risk. Therefore, it should not be assumed that future performance of any specific investment or investment strategy will be profitable. Please click here for important disclosures.”
