As the United States teetered on the possibility of defaulting on its sovereign debt during tense weeks in May, global equities slipped -1.07% in May bringing the MSCI All Country World Index (ACWI) return to 7.68% so far in 2023. As of month end, the House of Representatives had passed a bill to suspend the nation’s debt ceiling and the bill headed to the Senate. U.S. Treasury Secretary Janet Yellen had warned that as of June 5th the government wouldn’t be able to pay its bills (spoiler alert: President Biden signed the legislation on June 2). With the stakes so very high and negotiations going down to the wire, the CBOE Volatility Index (VIX), referred to as the “fear-gauge,” rose nearly 14% over the course of May to finish the month at 17.94. Month-end pricing of credit default swaps tied to U.S. debt showed that while expectations of a default had lessened, some investors were still assessing a ~1.3% chance of the possibility that the U.S. would miss paying its debt obligations for the first time in the nation’s history.
Click the image to view the chart larger.
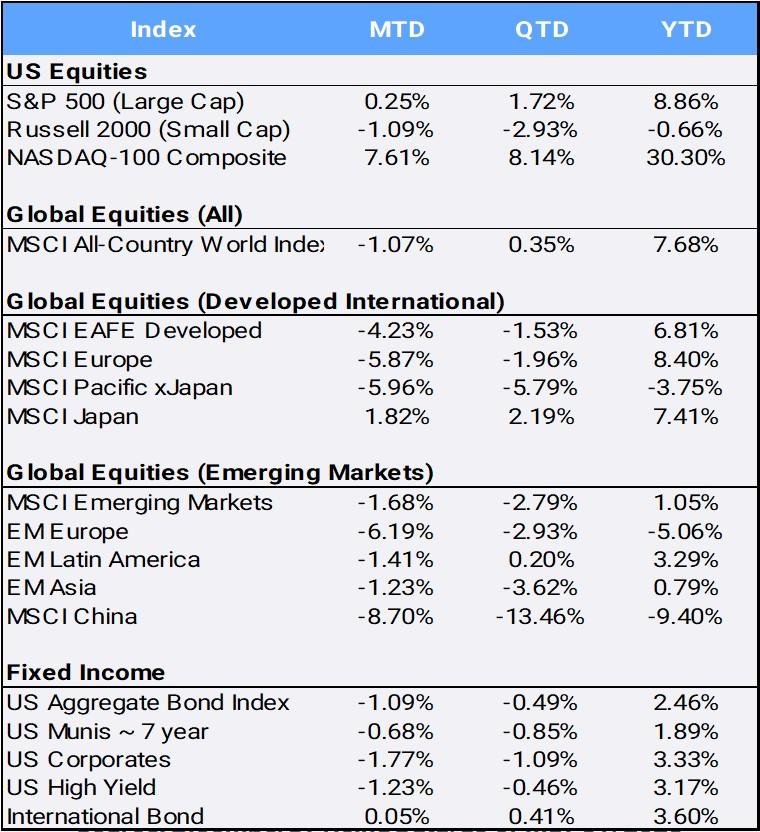
Source: Bloomberg Pricing Data, as of May 31, 2023
Thanks in no small part to a strong employment report, the U.S. Federal Reserve hiked interest rates at its May meeting for the tenth time in the past 12 months. Minutes from the meeting showed great internal debate over whether a “pause or skip” might be next, as concerns over debt ceilings, inflation, and risks in the banking sector grow. U.S. bonds sold off amidst the uncertainty; the U.S. Aggregate Index fell -1.09% in May while the two- and ten-year rates increased to 4.40% and 3.64% respectively by month’s end (prices and yields move in opposite directions). The short and long rates have been inverted for all of 2023.
In the U.S., markets were mixed. The blue chip Dow Jones Industrial Average and small-cap Russell 2000 slipped -3.49% and -1.09% in May, bringing their respective returns into the red at -0.72% and -2.93%. The S&P 500 was able to manage a 0.25% gain in May and is up 8.86% so far in 2023. However, that is colored by the fact that just seven stocks have contributed to 97% of the index’s YTD return: Apple (+36.82% YTD), Microsoft (+37.57%), Nvidia (+158.93%), Amazon (+43.55%), Meta (+119.98%), Tesla (+65.55%), and Alphabet (+39.26%). Those mega cap names have also helped fuel the Nasdaq’s +7.61% May and +30.30% YTD returns.
May was a hot month for the tech sector (+8.84%), particularly chip stocks (+16.7%) and growth names. The top gainer was semiconductor chip maker Nvidia, which briefly reached $1 trillion market cap and was up +36.63% for the month as investors stampede to Artificial Intelligence (AI)- themed stocks. Nvidia is also in the Russell 3000 Growth Index and helped catapult the style strategy to its first three-month winning streak since December 2021. While the growth style climbed 4.17% in May and is up +19.25% on the year, its counterpart Russell 3000 Value Index fell -3.99% MTD and is now down -2.58% YTD. Outside of the tech sector, gains were hard to come by. The S&P 500 has experienced a very uneven 2023 rally, with the previously mentioned seven mega caps driving almost all the benchmark’s YTD returns. Eight of the 11 S&P sectors are down for the year, and last year’s darling, energy (which popped +64.56% in an otherwise challenging 2022), is the laggard in 2023: off -11.56%.
Overseas, Germany’s DAX Index closed in on all-time highs before faltering and finishing May down -1.62%. However, Japan’s Nikkei 225 maintained its highest levels since 1990, while the MSCI Japan index gained 1.82% in May to bring YTD returns to +7.41% and making it the MSCI ACWI’s second-largest country contributor to returns behind the U.S.. Japan’s Q1 GDP expanded by +1.6%, reversing two consecutive quarters of contraction, whereas the German economy entered a technical recession as Q1 GDP was revised downward to -0.3%, following a -0.5% decline in Q4 2022.
Japan is emerging as an attractive alternative for global investors as frustration grows regarding Chinese equity markets. Hong Kong’s Hang Seng index hit a session low this month that was 20.5% below its 52-week closing high reached on Jan. 27. (A bear market is technically defined as when prices drop 20% below recent highs.) Further evidence of a global decoupling: while U.S. tech stocks climb ever higher, the Hang Seng Technology Index has fallen by more than 25% from its January peak. This is a stark contrast to the post-Covid reopening optimism that had at one point driven Asia-Pacific’s benchmark MSCI Asia Pacific Index into a bull market. Analysts had initially expected China’s economy to recover faster and earlier than expected, but that view quickly faded after the country continued to deliver disappointing economic data. China is the biggest drag on MSCI ACWI 2023 returns, as the country index is now down -9.40% YTD.
A shift in Asia-focused portfolios seems to be underway as major markets also decouple from China: The tech-heavy markets of South Korea and Taiwan have rallied +17.94% and +13.47% YTD as demand surges for all things AI and the chips that drive it. In India, a growing retail investor base and solid earnings are adding to the appeal of local stocks, helping drive the Nifty 50 Index to levels just ~2% below its all-time high.
The world’s largest crypto currency, Bitcoin, fell -7.62% in its first down month of the year as optimism around the debt ceiling rally fizzled in May. It closed at $26,793, up 63.56% YTD and a big improvement from its November 2022 low of $15,760 – but a long way from its 2022 open at $47,733.
Disclosure Statement
Perigon Wealth Management, LLC (‘Perigon’) is an independent investment adviser registered under the Investment Advisers Act of 1940. More information about the firm can be found in its Form ADV Part 2, which is available upon request by calling 415-430-4140 or by emailing compliance@perigonwealth.com
Performance
Past performance is not an indicator of future results. Additionally, because we do not render legal or tax advice, this report should not be regarded as such. The value of your investments and the income derived from them can go down as well as up. This does not constitute an offer to buy or sell and cannot be relied on as a representation that any transaction necessarily could have been or can be affected at the stated price.
The material contained in this document is for information purposes only. Perigon does not warrant the accuracy of the information provided herein for any particular purpose.
Additional Information regarding our investment strategies, and the underlying calculations of our composites is available upon request.
Data Source: Bloomberg Pricing Data, as of May 31, 2023.
Annual Form ADV
Every client may request a copy of our most current Form ADV Part II. This document serves as our “brochure” to our clients and contains information and disclosures as required by law.
Perigon Wealth Management, LLC is a registered investment advisor. Information in this message is for the intended recipient[s] only. Different types of investments involve varying degrees of risk. Therefore, it should not be assumed that future performance of any specific investment or investment strategy will be profitable. Please click here for important disclosures.”