Global stocks tumbled 7.18% in March, in a brutal first quarter bringing 2026 returns into the red. The MSCI All Country World Index’s (ACWI) is now down 3.20% YTD and sits 6.08% below its February all-time high. US equities attributed to 44% of the ACWI MTD loss and 87% of its QTD loss as the S&P 500 dropped 5.09% in March and fell 4.63% in Q1 – its worst quarter since 2022.
The downturn was fueled by a “perfect storm” of headwinds: tariff-related anxiety, cooling sentiment toward artificial intelligence capital expenditures, and mounting liquidity concerns in private credit. Geopolitical risks heightened as the US launched its “Operation Epic Fury” against Iran which sent oil prices higher, shifting the market narrative toward stagflation and global energy disruption.
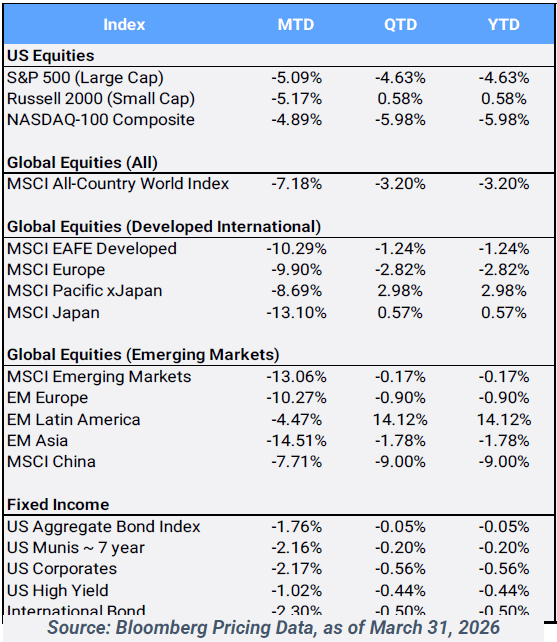
Source: Bloomberg Pricing Data, as of March 31, 2026
Click image to enlarge
- The CBOE S&P Volatility Index (VIX), often referred to as “the fear index”, traded as high as 31.01 on March 27th, its highest level since last April’s tariff turmoil. However, stocks ended the quarter on a high note, as the S&P surged 3.01% on the final trading day of March after Iran’s official news agency said the country’s president was open to ending its conflict with America. It was the SPX’s largest one-day advance since last May’s truce on trade between the US and China. Still, the VIX closed the month at 25.25, up 68.90% from where it started the year at a seemingly complacent 14.95.
- With the sell-off in global stocks, even bonds were unable to provide traditional defensive refuge. Across the credit spectrum and various geographies, major fixed-income indices posted losses in March, dragging most segments of the asset class into negative territory for the year. Rising energy costs have reinvigorated the inflation narrative, pushing US Treasury yields to eight-month highs. The 10-year note yield jumped as high as 4.48%, before settling the month at 4.32%. Many see the US-Iran conflict weakening the case for the US Federal Reserve cutting interest rates anytime soon as higher energy prices inevitably filter into consumer costs and inflation expectations. On the employment front, the labor market showed signs of cooling, with softer job growth. Still, overall unemployment remains low and stable, but stagflation worries are mounting. Consequently, the Fed left rates unchanged in March, adopting a “wait-and-see” stance as it assesses the inflationary fallout from energy volatility and ongoing geopolitical instability.
- While stocks and bonds faltered in Q1, the alternative commodity market provided much-needed diversification relief. The Bloomberg Commodity Index soared 11.50% in March, capping off an impressive 24.01% QTD performance. Crude oil skyrocketed 51.27% MTD bringing QTD returns to a staggering 76.56% as the conflict in the Middle East threatened critical supply routes, specifically the Strait of Hormuz which facilitates approximately 20% of global oil flows. Conversely, precious metals sold off in March, which was unusual for these typical “safe haven assets” that often provide stability during times of conflict and turmoil. Gold fell 11.57% in March, its first down month in nine, yet is still up 8.07% QTD. Silver fell 19.85% MTD and while maintaining a 4.89% Q1 return.
- Unsurprisingly, energy was the only sector up in March, gaining 10.28% MTD, and leading Q1 with its commanding 37.87% climb. Industrials were the primary laggard in March, dropping 8.44%, while Financials took the title of worst performing sector for Q1, falling 9.35%. Consumer Discretionary and Technology were the next worst performing Q1 sectors, down 8.53% and 7.51%, respectively. The Technology sector was weighed down by Meta and Alphabet, with losses of 13.26% and 8.52% QTD, respectively, as both were found liable for social media addiction in two separate landmark trials. Still, there was evidence of diversification benefits away from traditional market cap weighted indexes in Q1, as the equal weight S&P 500 index, representing the average stock, eked out a 0.19% QTD gain. Small cap stocks also finished the quarter up 0.58%. On the style front, the Russell 3000 Value Index gained 1.73% versus its growth stock peers’ decline of 9.67% this quarter.
- On the international front, the largest positive contributors to ACWI in Q1 were South Korea (16.06%), Taiwan (10.76%), and Brazil (19.10%). However, even these Q1 outperformers were not immune to the “March carnage”, those quarterly returns were lessened by their negative MTD returns of 25.61%, 10.99%, and 1.88%, respectively. India, China, and Germany were the largest negative detractors to Q1 ACWI returns behind the US, as those markets dropped 18.13%, 8.33% and 8.47%, respectively.
- Lastly, Bitcoin and Ethereum, often referred to as “digital gold and silver”, acted in divergent patterns from their physically referenced counterparts, as both posted positive gains in March (up 4.07% and 9.62%, respectively) lessening their QTD declines (off 22.20% and 29.27%, respectively).
-
Disclosure Statement
Perigon Wealth Management, LLC (‘Perigon’) is an independent investment adviser registered under the Investment Advisers Act of 1940. More information about the firm can be found in its Form ADV Part 2, which is available upon request by calling 415-430-4140 or by emailing [email protected]
Performance
Past performance is not an indicator of future results. Additionally, because we do not render legal or tax advice, this report should not be regarded as such. The value of your investments and the income derived from them can go down as well as up. This does not constitute an offer to buy or sell and cannot be relied on as a representation that any transaction necessarily could have been or can be affected at the stated price.
The material contained in this document is for information purposes only. Perigon does not warrant the accuracy of the information provided herein for any particular purpose.
Additional Information regarding our investment strategies, and the underlying calculations of our composites is available upon request.
Data Source: Bloomberg Pricing Data, as of March 31, 2026.
Annual Form ADV
Every client may request a copy of our most current Form ADV Part II. This document serves as our “brochure” to our clients and contains information and disclosures as required by law.
Perigon Wealth Management, LLC is a registered investment advisor. Information in this message is for the intended recipient[s] only. Different types of investments involve varying degrees of risk. Therefore, it should not be assumed that future performance of any specific investment or investment strategy will be profitable. Please click here for important disclosures or visit our website at perigonwealth.com.