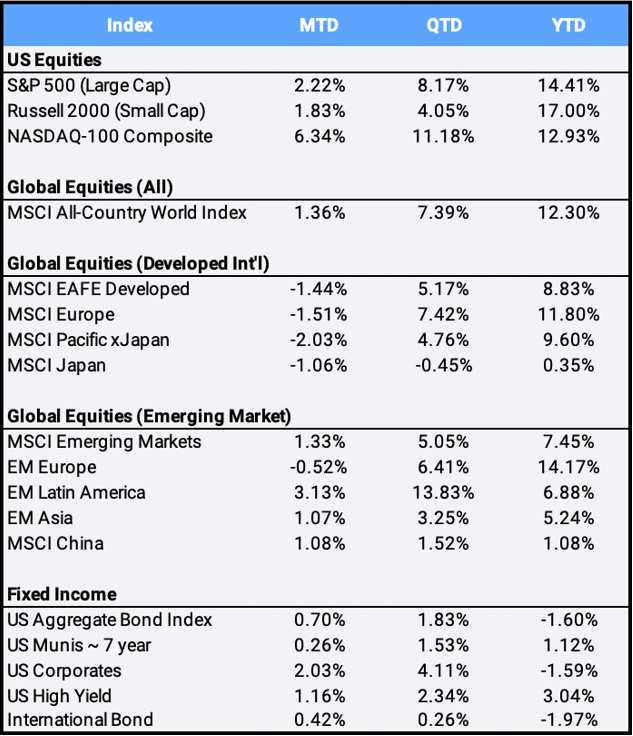
Global equities rose 1.36% in June to bring Q2 and YTD returns to 7.39% and 12.30% respectively. The U.S. comprises more than 58% of the MSCI ACWI All Country World Index ( ACWI), and the S&P 500 finished the first half of the year by notching its 33nd record close of 2021. The U.S. large-cap benchmark gained 2.22% in June to bring QTD and YTD returns to 8.17% and 14.41% respectively, marking its second-best first-half return since 1998. The gains came as nearly 60% of U.S. adults have received a COVID-19 vaccine, allowing a rapid resumption of economic activity.
Click the image to view the chart larger.
Source: Bloomberg Pricing Data, as of June 30, 2020
The large-cap and technology-dominated Nasdaq 100 index gained 11.18% in Q2 to pull YTD returns to 12.93%. However, “big tech” faces renewed scrutiny as a US House committee advanced legislation to curb the market dominance of domestic tech giants. Globally, regulators are also scrutinizing technology: Facebook is embroiled in a dispute with India over encryption, and both the EU and the United Kingdom have announced antitrust investigations of Apple and Google.
International market returns for the quarter and first half were highly respectable, though lagging their U.S. counterparts. The MSCI EAFE developed market stocks gained 5.17% QTD and 8.83% YTD, while the MSCI Emerging Markets returned 5.05% in Q2 to bring 2021 returns to 7.45% YTD. Investors worries are focused on a contagious strain of the delta variant of the COVID-19 that may dent the economic recovery overseas, where vaccination rates have lagged that of the U.S.
The US Aggregate Bond Index rebounded 1.83% in Q2, following its 3.37% plunge in Q1 that marked its worst quarterly return since September 1981. The 10-year treasury yield started Q2 at 1.74% and finished at 1.46%, with bond prices moving move inversely to interest rates. In Congressional testimony Federal Reserve Chair Jerome Powell acknowledged some uncertainty around price increases but reiterated that they will likely wane.
A flurry of speeches from Fed governors produced mixed messages, with some assuring that rate hikes and tapering are off in the future, while others took a more hawkish stance citing speculative bubble concerns. The surge in U.S. home prices during the pandemic also has been a key focus. The Case-Shiller National Home Price Index recorded an increase of 14.6% over the past year, surging to the fastest pace ever as buyers competed for a limited number of homes. The separate 20-city index, which gauges home prices across a group of major cities around the country, increased at over the past year by 14.9% in April, well past the 13.3% growth recorded the month prior. “These are growth rates that rival the bubbliest years of the mid-2000s housing boom!” wrote analysts at BCA Research.
In Europe, European Central Bank President Christine Lagarde brushed off inflation concerns, saying the U.S. recovery was ahead of the Eurozone’s. International bonds gained 0.26% in Q2 but are down 1.97% YTD. A basket of international currencies appreciated 0.28% against the U.S. dollar in Q2, but is down 0.93% YTD against the stronger 2021 greenback.
The US Core Personal Consumption Expenditure (PCE) Price Index rose 3.4% in May, the fastest increase since 1992, with most of the inflation surge coming from energy prices. Crude oil prices traded over $74/barrel on June 25th, their highest level since October 2018, as U.S. inventories continued to decline and summer travel heated up.
Second-quarter sector returns ranged from Real Estate’s best 13.09% QTD gain to Material’s worst -5.23% QTD return. So far on the year, all eleven sectors are up, led by Energy’s 45.22% YTD best performance so far in 2021.
Bitcoin closed June at 34,585. The world’s largest cryptocurrency experienced a second-quarter price drop of 41.34%, snapping a four-quarter winning streak that saw prices chart a sixfold rise to almost $65,000 in April. Even after the shellacking, the asset billed as “digital gold” remains up 19.27% YTD.
Disclosure Statement
Perigon Wealth Management, LLC (‘Perigon’) is an independent investment adviser registered under the Investment Advisers Act of 1940.
Performance
Past performance is not an indicator of future results. Additionally, because we do not render legal or tax advice, this report should not be regarded as such. The value of your investments and the income derived from them can go down as well as up. This does not constitute an offer to buy or sell and cannot be relied on as a representation that any transaction necessarily could have been or can be affected at the stated price.
The material contained in this document is for information purposes only. Perigon does not warrant the accuracy of the information provided herein for any particular purpose.
Additional Information regarding our investment strategies, and the underlying calculations of our composites is available upon request.
Data Source: Bloomberg Pricing Data, as of June 30, 2021.
Annual Form ADV
Every client may request a copy of our most current Form ADV Part II. This document serves as our “brochure” to our clients and contains information and disclosures as required by law.
Perigon Wealth Management, LLC is a registered investment advisor. Information in this message is for the intended recipient[s] only. Different types of investments involve varying degrees of risk. Therefore, it should not be assumed that future performance of any specific investment or investment strategy will be profitable. Please click here for important disclosures.”
