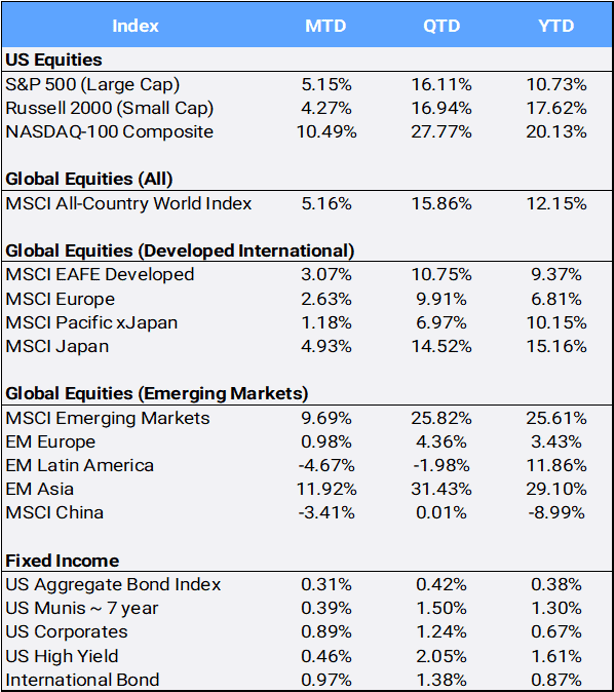
- Global stocks rallied 5.16% in May following their 10.17% surge in April, to close at an all-time high, and bring their 2026 return to 12.15% YTD. The MSCI All Country World Index (ACWI) continued higher as strong tech earnings and excitement on Artificial Intelligence helped propel the global benchmark to 12 all-time highs this month and bring its 2026 tally to 28. The past two months are the index’s fourth best return on record – only surpassed by December 2020, and twice in 2009 following the post-rally from the Great Financial Crisis. US/Iran diplomatic progress, declining oil prices, and the steady state of AI enthusiasm all helped eased investor nerves this month – as the CBOE S&P Volatility Index (VIX), referred to as “the fear index”, closed at a relatively mild 15.32 (after trading as high as 35.30 as recently as March 9th). A tilt to “risk on” was evident as the MSCI World Growth Index gained 6.89% MTD and 20.00% QTD relative to its Value index counterpart’s 2.02% MTD and 9.11% QTD return. However, the value style of investing is slightly ahead in 2026, up 9.88% compared to 9.68% YTD for the Growth index.
Source: Bloomberg Pricing Data, as of May 31, 2026
Click image to enlarge
- In the US, the S&P, the Nasdaq-100, Nasdaq Composite, and Dow Jones all closed the month at all-time highs. The Nasdaq Composite posted its best two-month return (24.93%) since 2002. Still, only three of the eleven sectors gained in May: Technology (15.99%), Consumer Discretionary (2.61%), and Healthcare (2.48%). Energy and Utilities were the worst monthly performers, falling 5.56% and 5.14% MTD, respectively. Energy still leads all sectors YTD, up 26.04%, followed by Tech’s 23.81% gain, while Financials are the biggest 2026 laggard, down 5.32% YTD.
- Fixed income performance was positive, despite longer-dated Treasury yields climbing toward multi-month highs amid persistent inflation concerns and shifting expectations for Fed policy. The 10-year U.S. Treasury note yield – the key benchmark for mortgages, auto loans, and credit card debt — closed May at 4.44% compared to the 4.17% rate at the beginning of the year. Meanwhile, the longer-dated 30-year Treasury bond yield, which tends to be most sensitive to geopolitical risks, started the year at 4.48%, but closed May at 4.97% – after trading just over 5.18% on May 19th, a level not seen since 2007. Hotter than expected CPI and PPI reports, showing year over year inflation running hot at 3.8% and 6%, respectively, not only crushed market expectations of a chance for a near-term rate cut, but the CME Fed Watch is now pricing in a possible rate hike by year’s end.
- Apple was the largest contributor to ACWI returns in May, up 15.11%, which has been on ten straight weeks of gains – its longest win streak since 2009. Micron was the second largest contributor, gaining 87.76% MTD, and is the largest YTD contributor, up 240.21%, while also becoming the latest stock to join the trillion-dollar market cap club. Overseas, Chinese president Xi Jinping hosted US president Trump and his US delegation that included CEOs representing more than 20% of the market cap of the S&P 500. The Beijing summit had the potential to generate market moving news; however, few deals were announced outside of a commitment by China to purchase 300 Boeing airplanes. The next week, Xi Jinping hosted Russian leader Vladimir Putin. While US stocks made all-time highs in May, China equities sold off 3.41%, to bring their YTD return to -8.99%.
- Overseas, South Korea’s Kospi and Japan’s Topix reached a new all-time high, as investors looked past renewed military activity involving Iran and focused on gains in technology shares. Korea’s Samsung Electronics surged 41.34% this month to bring its YTD return to 154.72% YTD and is the fourth largest contributor to AWCI returns this year. The company announced it has started shipping samples of its latest high-bandwidth memory chip to its global customers.
- In the MSCI ACWI country weightings, the US is still the juggernaut at a 64.9% index weight and Japan follows at a distant second at 5.0%. Taiwan (3.1%) recently leapt past Canada (2.8%) for the third spot. Taiwan’s stock market performance has been driven by strong demand for AI-linked shares and the rapid rise of chip giant Taiwan Semiconductor Manufacturing Co – which was the second largest contributor to ACWI 2026 returns (behind Micron), up 52.67% YTD and has seen its market cap value swell to $1.8 trillion.
- What is interesting about “country classifications” is that while MSCI considers South Korea as an “Emerging Market” due to currency conversion and other “investible” criteria, the FTSE index classifies it as a “Developed Market” based on its more economic focused criteria. While there are other intricacies between the index providers, it is interesting that on the year, MSCI EM is up 25.61%, YTD compared to the FTSE EM’s 11.25% gain. Benchmark construction is indeed unique and important to understand!
- On that note, investors are gearing up for the SpaceX IPO, whose inclusion once it debuts trading will be handled differently by each of the major indexes as many providers look to possibly “fast track” inclusion of what promises to be a record setting debut. SpaceX recently cut its IPO value to an astonishing $1.8 trillion market valuation.
- Last, the broad-based Bloomberg Commodity Index fell 3.56% in May with severe losses in crude oil (off 16.86% closing May at $87.36/barrel) while industrial metals of silver (2.10%) and cooper (6.83%) were bright spots. Meanwhile, gold slipped 1.68%, as higher interest rates increase the opportunity cost of holding non-yielding assets. “Digital gold” also slipped as Bitcoin fell 3.77%.
-
Disclosure Statement
Perigon Wealth Management, LLC (‘Perigon’) is an independent investment adviser registered under the Investment Advisers Act of 1940. More information about the firm can be found in its Form ADV Part 2, which is available upon request by calling 415-430-4140 or by emailing [email protected]
Performance
Past performance is not an indicator of future results. Additionally, because we do not render legal or tax advice, this report should not be regarded as such. The value of your investments and the income derived from them can go down as well as up. This does not constitute an offer to buy or sell and cannot be relied on as a representation that any transaction necessarily could have been or can be affected at the stated price.
The material contained in this document is for information purposes only. Perigon does not warrant the accuracy of the information provided herein for any particular purpose.
Additional Information regarding our investment strategies, and the underlying calculations of our composites is available upon request.
Data Source: Bloomberg Pricing Data, as of May 31, 2026.
Annual Form ADV
Every client may request a copy of our most current Form ADV Part II. This document serves as our “brochure” to our clients and contains information and disclosures as required by law.
Perigon Wealth Management, LLC is a registered investment advisor. Information in this message is for the intended recipient[s] only. Different types of investments involve varying degrees of risk. Therefore, it should not be assumed that future performance of any specific investment or investment strategy will be profitable. Please click here for important disclosures or visit our website at perigonwealth.com.